Imagine Building a Diagram Just by Describing It
Imagine Building a Diagram Just by Describing It
AWS diagrams take about an hour by hand. About five minutes with AI — and we’re publishing the math, not just the claim.
AI diagram generation is live now in Diagram.now for Confluence. Paste your own text — a spec, a process description, whatever you’ve got, free form — and it builds the diagram: flowchart, org chart, AWS architecture, and the rest of the catalog.
Before writing this up, we went looking for a real number on what manual diagram-building actually costs you. Nobody publishes one. So we measured what we could, and this post shows the math.
No dragging shapes. No hunting for icons.
Imagine building a diagram just by typing what you mean — or talking it through with an AI, back and forth, until it looks right. That’s the actual workflow now: paste your notes, get a diagram, keep talking to it to refine — change a shape, add a step, rearrange — the way you’d brief a person, not fight a canvas. Give it your brand colors and it builds inside them.
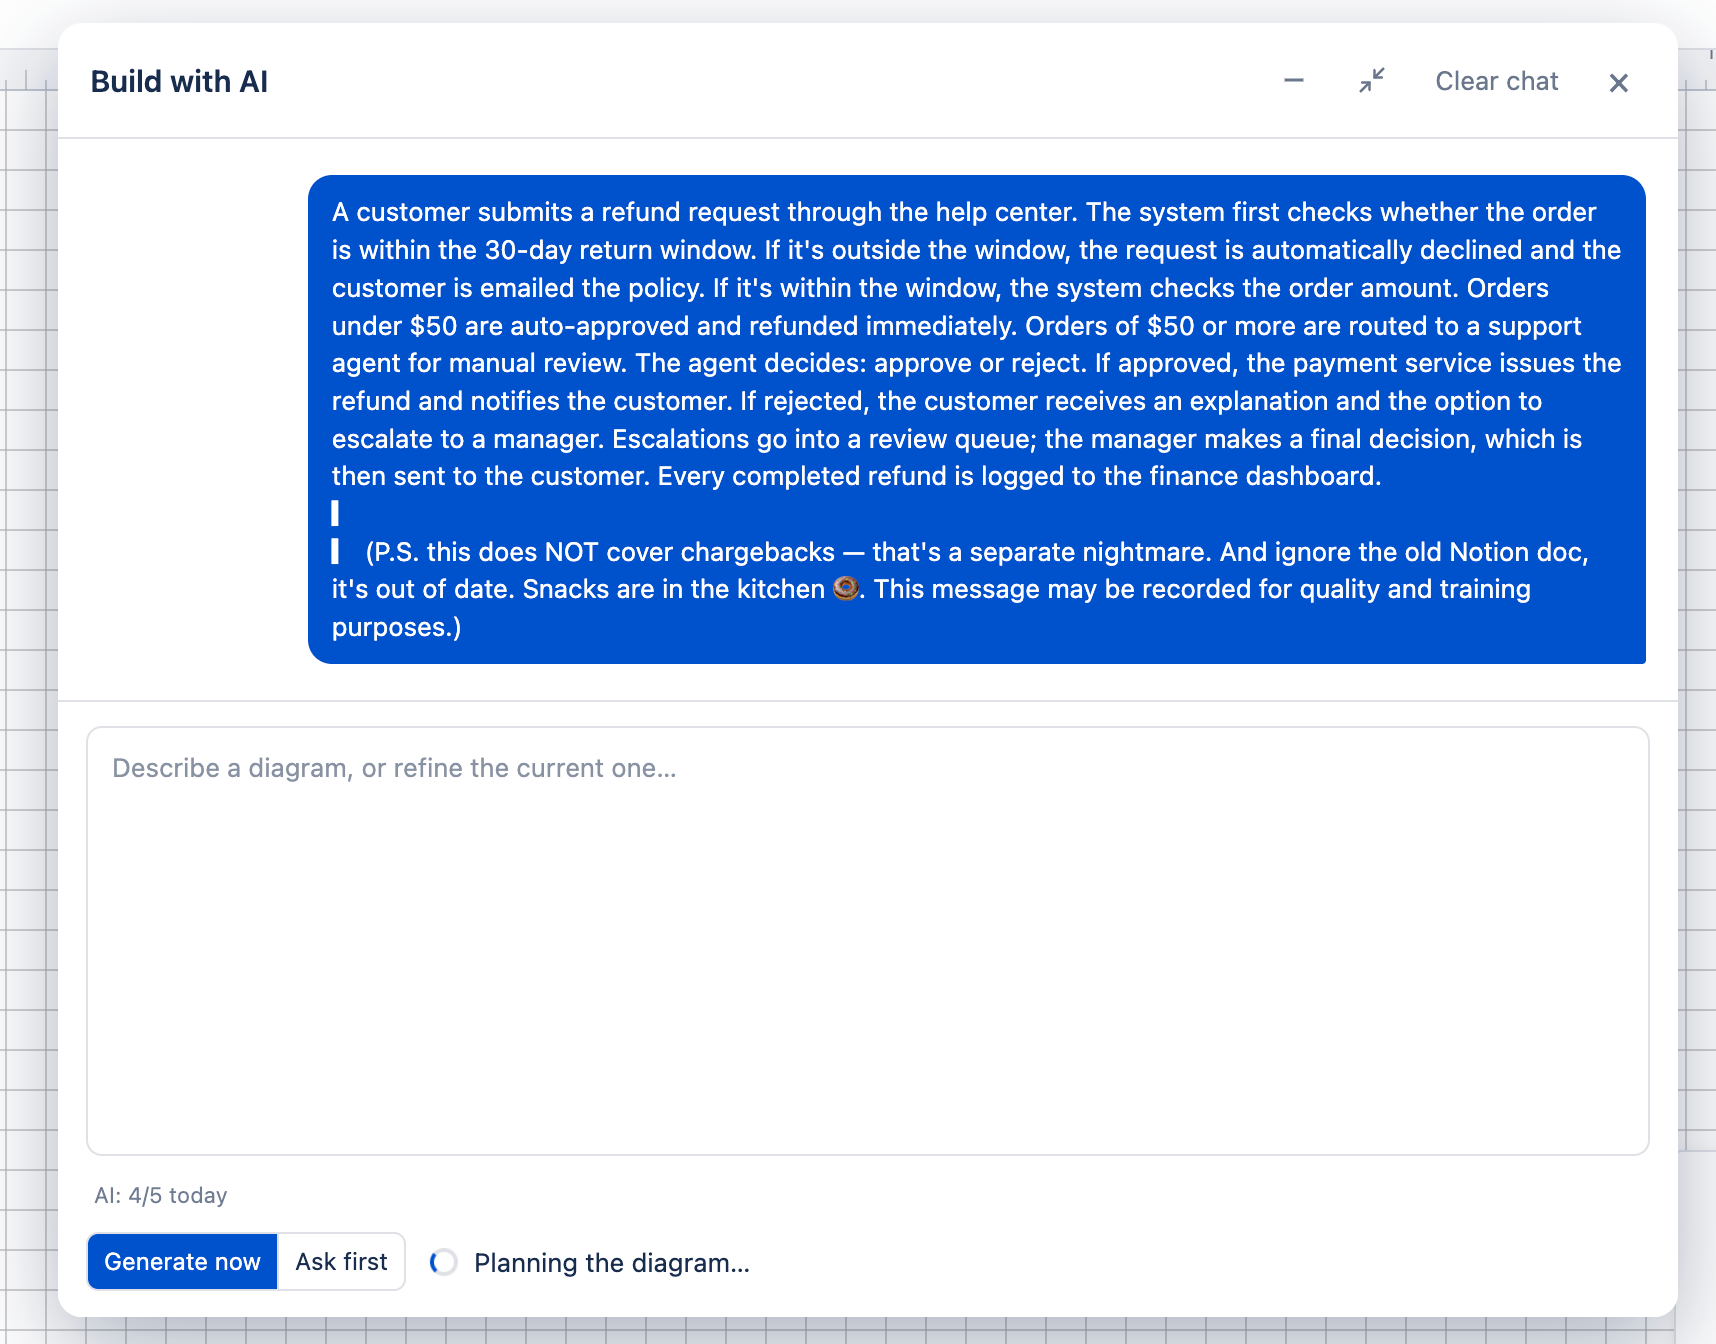

Not the first text-to-diagram AI you’ve seen
Atlassian shipped its own text-to-diagram agent for Confluence Whiteboards in April. It runs on Claude — the same models Atlassian gives every Forge developer, including whatever powers that agent. We use the same access. So this isn’t a “better AI” claim.
It’s a “much deeper diagram engine underneath the same AI” claim. Atlassian’s native agent covers basic mind maps and flow diagrams. Diagram.now runs on the draw.io-caliber catalog we’ve had since launch — 1,200+ shapes: AWS, GCP, Azure, BPMN, ERD, UML — with AI generation and conversation layered on top, plus a self-verification pass before it shows you anything.
Here’s what that’s actually worth
We wanted a real number, so we looked for a published benchmark on manual diagram-building time. There isn’t one — every “hours to minutes” claim in this category, including what we would have said last month, turns out to be marketing copy with no math shown. So we did the math ourselves.
By hand, a diagram takes anywhere from 20 to 90 minutes depending on what it is — a simple flowchart is faster than a 20-component AWS architecture, an org chart lands in between. With AI, it’s about 3–5 minutes either way, regardless of type. The high end of that range has the most real-world backing — it matches what AWS’s own developer advocates and cloud engineers describe independently. The lower end is our own reasoned estimate, since nobody has published a real study on this. If yours look different, reply and tell us — we’d rather have this be accurate than favorable.
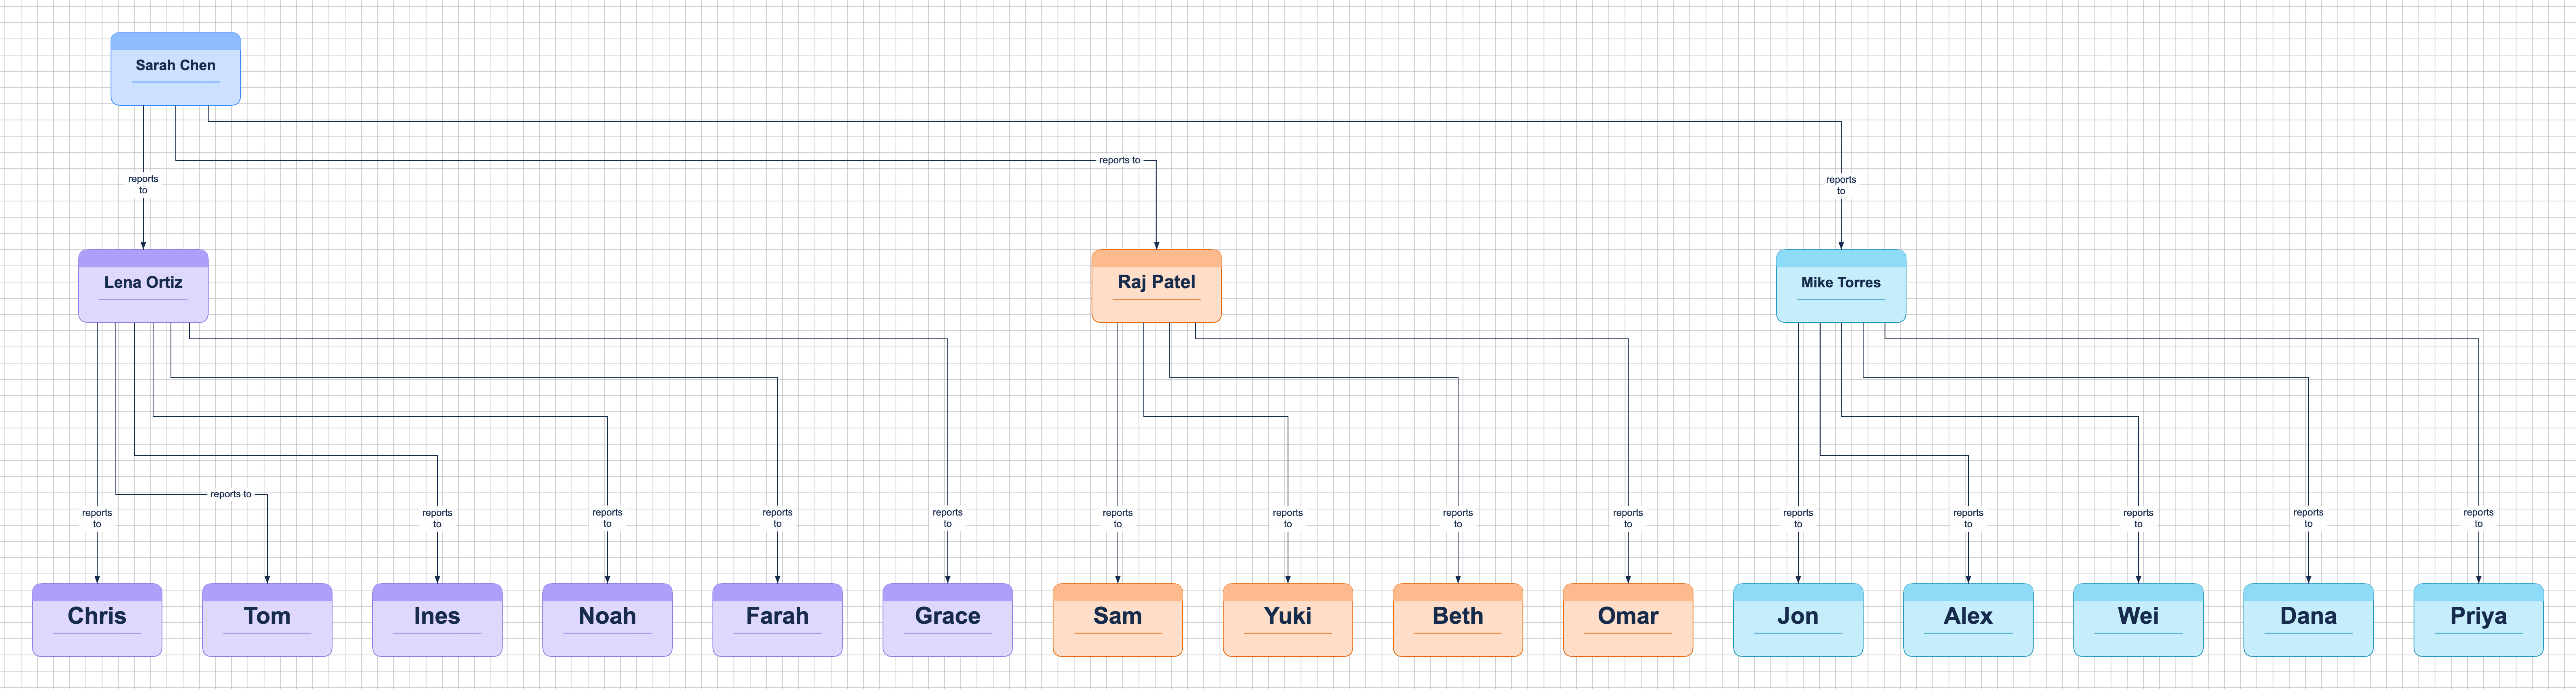
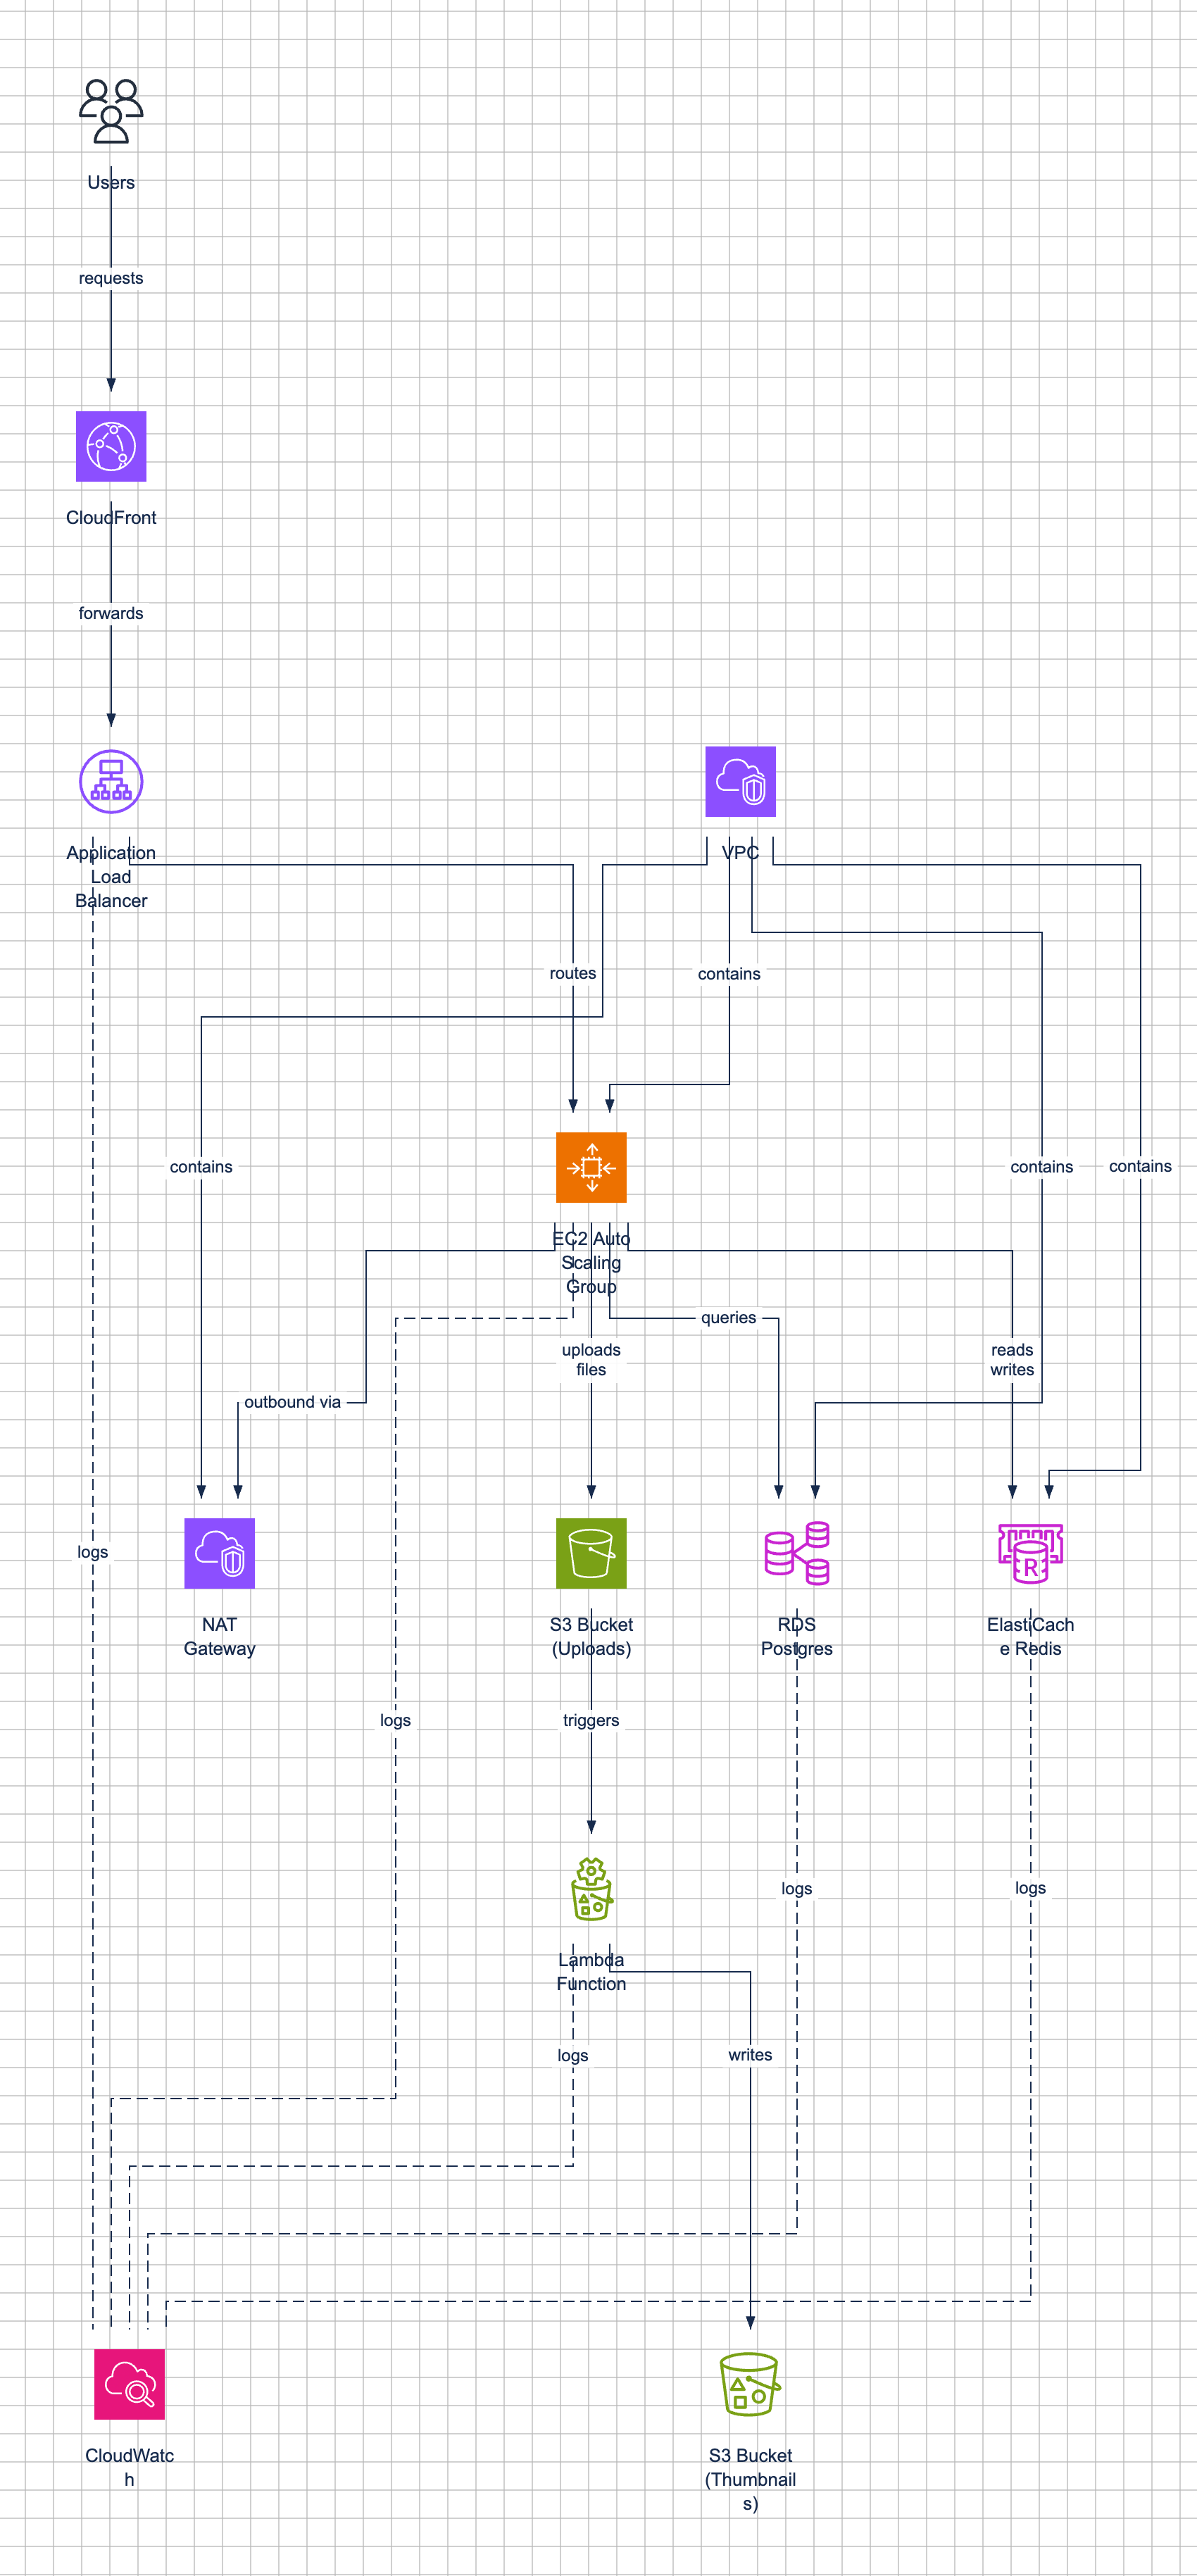
Multiply that across a real team and it stops being a party trick.
The math: ~44 minutes saved per diagram on average, assuming a roughly even mix of flowcharts, org charts, and AWS-style diagrams. 20 diagrams × 44 minutes is about 15 hours a month — $1,000–1,100/month at $70–75/hr, $12K–13K/year. The 20-diagrams-a-month figure is our own planning assumption for a mid-size team — nobody publishes a real number for this either, so treat it as a starting point, not a benchmark. Scale it to your own team by swapping in your actual diagram count. And that’s before counting the diagrams that go stale and need a redo, which every source we found flagged as the bigger, ongoing cost.
Where your content goes: generation runs through Atlassian’s own hosted infrastructure — your Confluence content doesn’t leave the Atlassian platform to reach an external AI vendor. We won’t claim more than that: Atlassian’s own public documentation doesn’t clearly say whether this traffic is covered by its newer AI-training policy, so we’re not going to guess in either direction.
Paste your own text and see what it builds.
Try AI generation in Diagram.nowManual-time estimates for flowcharts and org charts are our own reasoned estimates, cross-checked against thin secondary sources (no rigorous published benchmark exists for either). The AWS estimate is corroborated by independent accounts from AWS developer advocates and cloud engineers describing similarly-scoped diagrams. Hourly-cost figure derived from BLS Occupational Employment and Wage Statistics plus Glassdoor product-management data, blended across software developer, technical writer, and product manager roles, with a standard fully-loaded multiplier applied.
— Artem, Votazz